Premium
Inkdex E-Commerce Illustrations
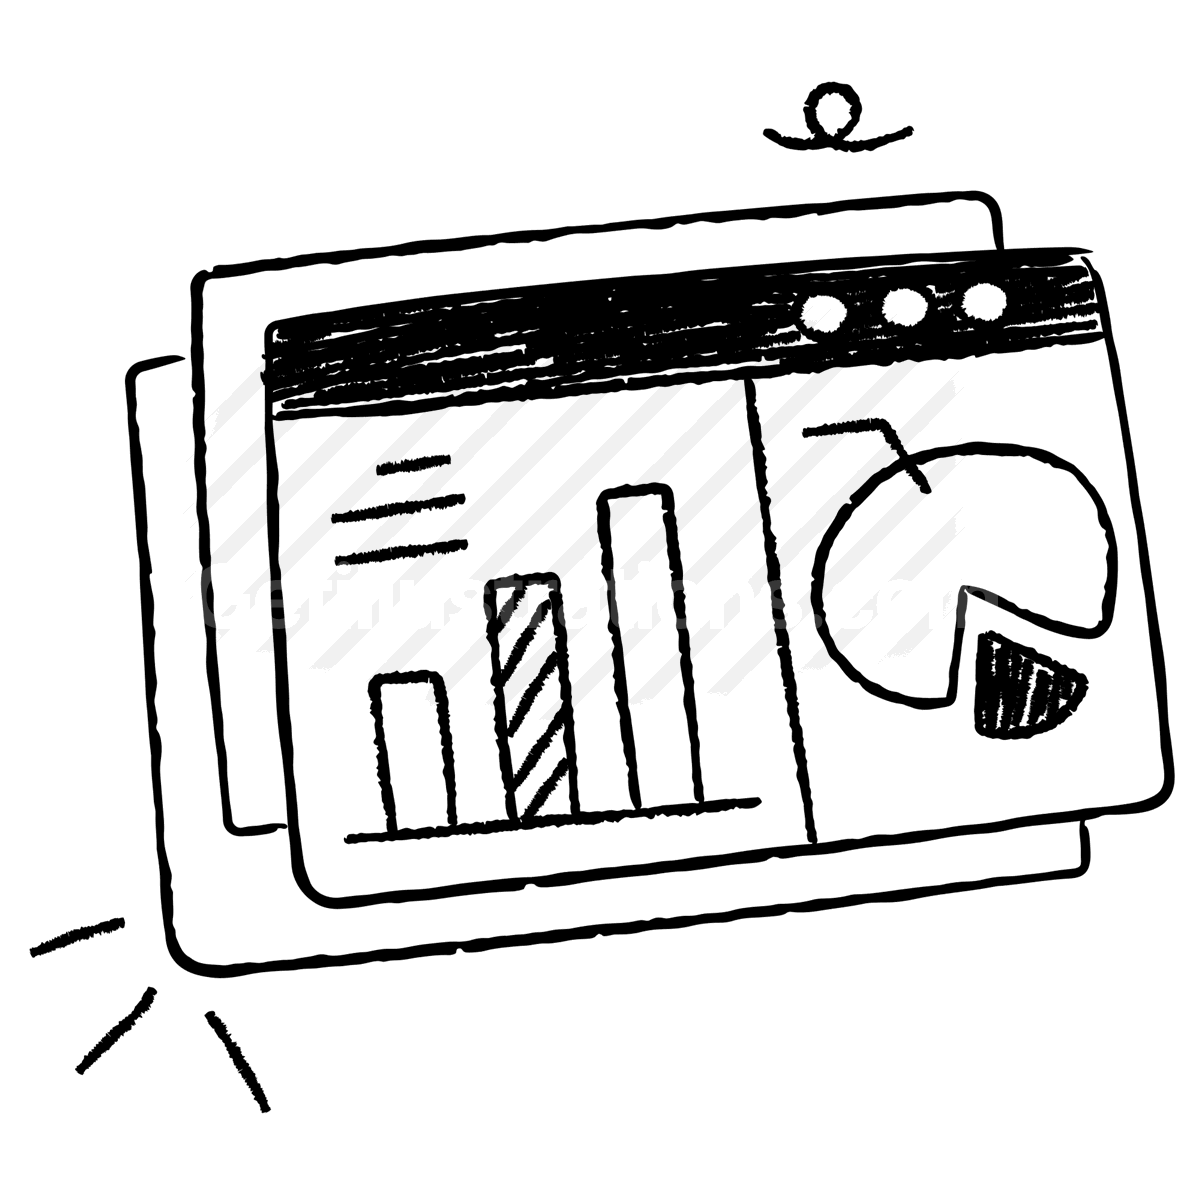
Data and Analytics data analysis, analytics dashboard, business intelligence illustration
Description
This illustration features a hand-drawn design depicting a graph and pie chart, symbolizing data analytics and visualization. The combination of bar and pie charts effectively conveys the essence of statistical representation, making it particularly suitable for educational materials, presentations, and digital platforms that aim to communicate complex data in a simplified manner. The sketchy style adds a creative touch, making the illustration accessible and engaging for diverse audiences. It can be utilized in blog posts, infographics, or marketing materials focusing on data interpretation and business insights.
File types
Topic
License
Commercial and personal use license
Keywords
Related Packs
Welcome Product hunters
We’ve prepared something special for you
- 25% Discount code: Hunters25Off
- A special illustration pack for product hunt And your stack - Free Download


 110 Illustrations


